
UEFA Revenue Distribution for the 2025/26 Season - Champions League
How much could your club get paid?

When you hear the Champions League anthem, it gives you goosebumps. - Casemiro
Every year, the UEFA Executive Committee approves a revenue distribution for the UEFA club competition cycle. This report outlines the distribution of commercial revenues for the Champions League, Europa League, and the Conference League. I highly suggest reading the report on your own time, but in the meantime, allow me to break down the key points to help highlight just how lucrative a run in Europe could be for your club.
Let’s start from the top. UEFA expects to generate €4.4 billion in gross commercial revenue for the 2025/26 season. The federation then makes several deductions, as follows:
€387 million for organisational and administrative costs.
€308 million (equal to 7% of gross revenue) for solidarity payments given to clubs that do not participate in the league phase of any of the three competitions.
€132 million for clubs participating in the qualifying rounds of the three competitions.
€22 million as part of a distribution scheme for the UEFA Women’s Champions League.
€3 million for the UEFA Youth League.
After these deductions, UEFA still anticipates a staggering €3.55 billion in revenue. For added context, the Premier League generates more than double this figure in revenue. We may look at a comparison between the major European leagues and their revenue streams at a later date, but in the meantime, Deloitte has a number of excellent reports on the matter. Nevertheless, the amount of cash flowing around England’s top flight is genuinely remarkable.
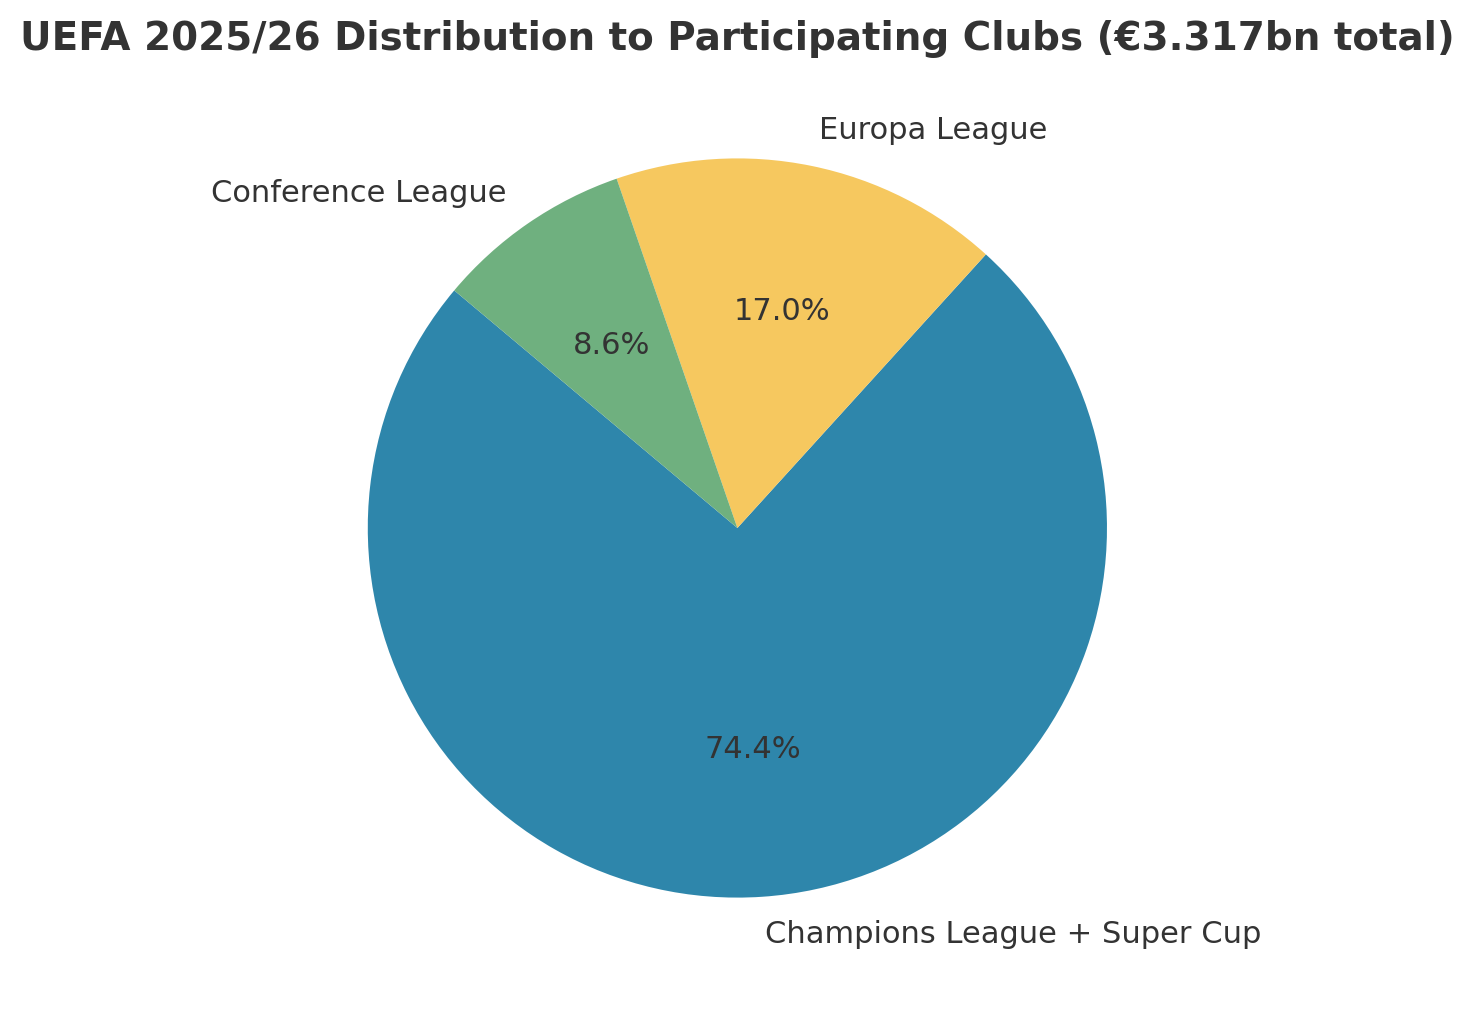
Of the €3.55 billion, 93.5% (€3.3 billion) is distributed to clubs participating in the competitions, with the remainder kept by UEFA. The chart below shows how the €3.3 billion is distributed amongst the three competitions. We will be focusing on the Champions League today.
The mechanics of how exactly each of these pools are distrbuted is fairly simple. There are three pillars: Equal Shares, Performance-Related Amounts, and a new Value Pillar.
Champions League and Super Cup
Let’s start with the Champions League Play-Off Round. Teams that were eliminated earn a fixed payment of €4.29 million, while clubs who win do not receive a specific payment and are instead ushered into the main pool for all clubs involved in the league phase.

With 36 teams confirmed for the league stage, we can now examine the three pillars that determine each team’s distribution.
Equal Shares (Starting Fee): €670 million (27.5% of the Champions League pool)
Each club receives a starting fee = €18.62 million
This is paid in two instalments: a down payment of €17.87 million, followed by an additional €750k.
Performance-Related Amounts: €914 million (37.5%)
As you would expect, club’s who do well in the competition are rewarded accordingly. Money is paid for both wins and successful progression to future rounds.
League Phase Match Bonuses
Win = €2.1 million / Draw = €700k
Any money left over from draws is pooled and redistributed proportionally among all clubs based on their final league ranking.
League Ranking Bonus
UEFA employs a share system, where each share is worth €275k. 36th place will receive one share, and one additional share is added for each additional rank, so first place receives 36 shares = €9.9 million from this mechanism.
On top of the share system, clubs from 1st to 8th receive an additional €2 million each, and 9th to 16th receive €1 million each.
Knockout Stage Qualification Bonuses
Each stage has a further bonus.
Knockout Play-Off Round (clubs ranked 9th-24th) = €1 million
Round of 16 = €11 million
Quarter-Finals = €12.5 million
Semi-Finals = €15 million
Final = €18.5 million
Winner = €6.5 million
Value Pillar: €853 million (35%)
While the Value Pillar is inherently more complex than the previous two, it is still a relatively simple system. The idea is to distribute amounts that are proportional to the media rights sales in UEFA (European) and all other (Non-European) markets.
European Part (€622.69 million)
This component is based on a club’s average rank across two different tables: a club market value ranking and a 5-year UEFA coefficient ranking. Using these two metrics, all 36 clubs are ranked, again employing a share system where each share is worth €935k (notably higher than the value of shares for actual league placement). The club market value ranking is a function of the TV revenue each team is attributed to.
Non-European Part (€230.31 million)
Based solely on the 10-year UEFA coefficient ranking of the 36 clubs (deducting bonus points for past titles - personally, I found this distinction a bit strange). Again, a share system is used, with each share worth €346k.
What about the Super Cup? The two participating teams receive €4 million each, with the winner receiving an additional €1 million.
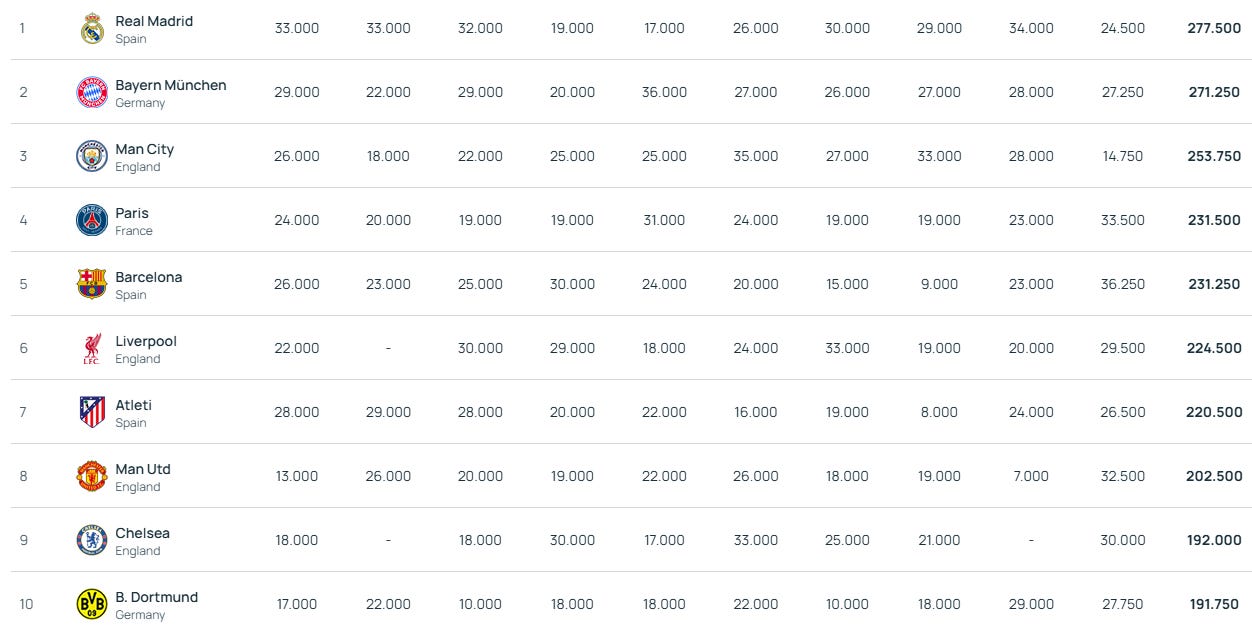
And that’s it! Simple right? Jokes aside, I do think UEFA have done a reasonably good job in rewarding on-field performance, whilst still valuing the European juggernauts who, regardless of performance, will always attract attention to the competition. The Manchester United example above intrigues me, as it demonstrates the power of being a traditionally large European team.
That being said, I am not 100% sold on the idea of teams with similar performances and even team coefficients receiving materially different payouts (this is possible via the club market value ranking system within the European part of the Value Pillar). While not covered here, it is actually possible for teams in the Europa League to receive less money than teams in the Conference League during the group stage, due to the Value Pillar. It’s rare, and does not apply to the Champions League, but I would critique UEFA and suggest that the Europa League prize pool be increased to prevent this phenomenon from occurring.
A Worked Example - PSG
Hopefully, I’ve done a decent job explaining the process thus far, but I think an example would really help highlight how the system works. I’ve decided to use PSG as our example.
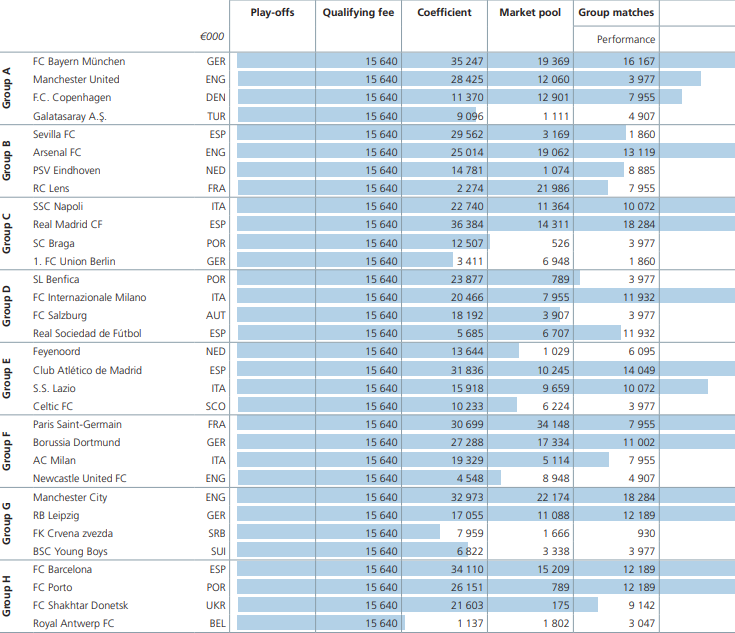
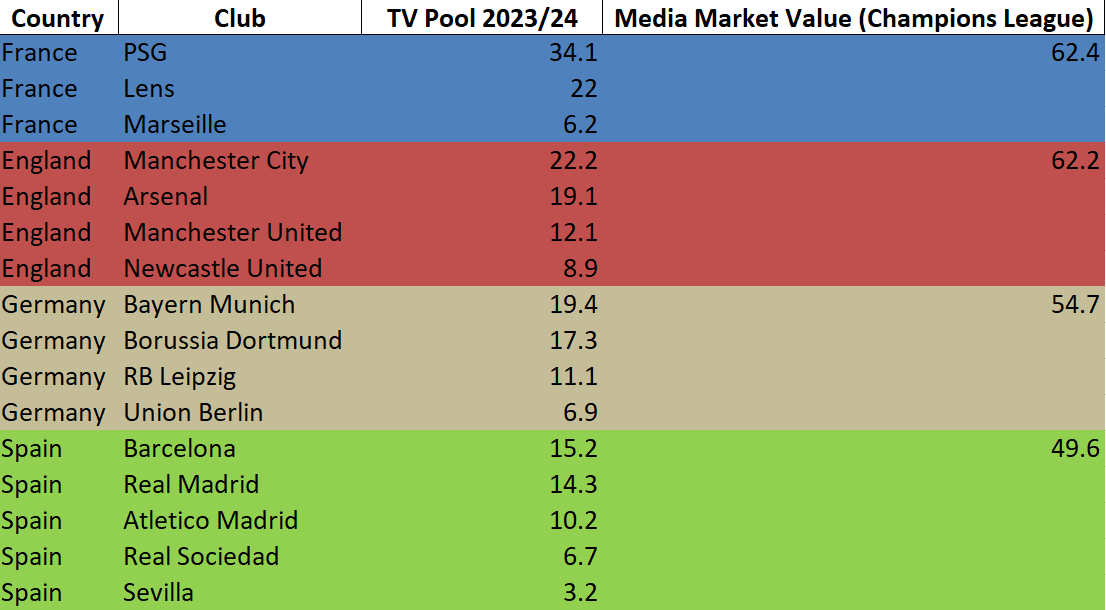
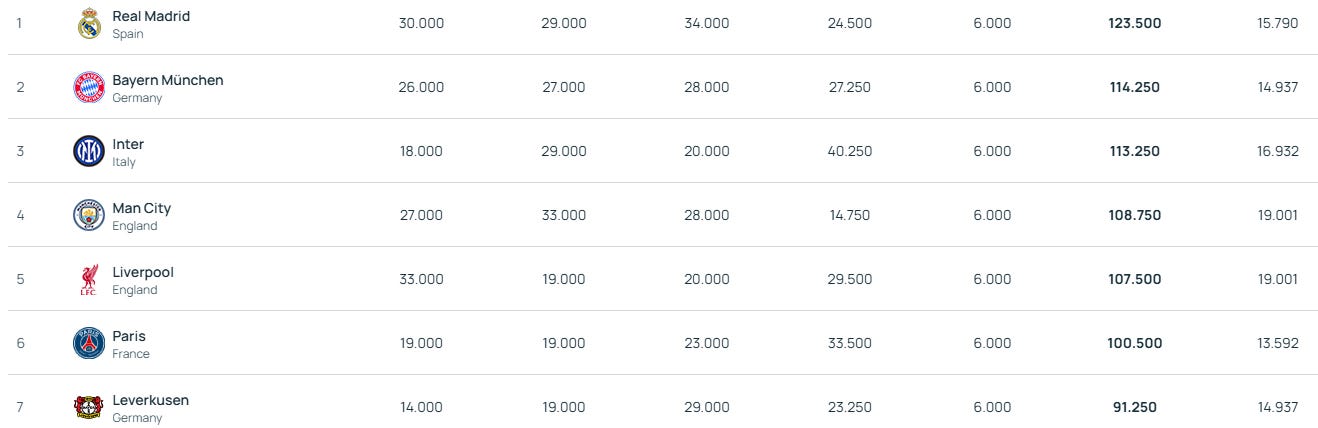
We will start with the European Value Pillar, as that is by far the most complex payout to calculate. The most recent data is from the 2023/24 season, so we will work backwards to determine what PSG will earn this season. The table below shows the actual payouts each team received in 2023/24 - Market pool refers to the club value calculation we were talking about earlier.
Unfortunately, there’s more to this calculation than simply determining who has the highest market pool payment. In reality, we first need to find which country had the highest media market value, by simply adding the payments of each team from each country.
Doing this does actually put France just ahead of England, at €62.4m, thanks to a huge chunk of revenue being paid to Lens as well as Marseille (not shown in this particular chart as they were eliminated before the group stage).
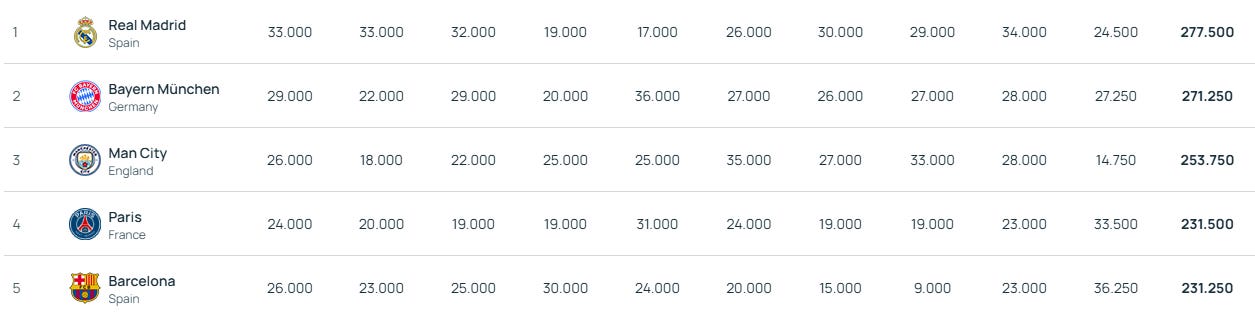
Once we have identified the nation with the highest media market value, we can then rank each club within that nation. However, regardless of how French media market values compare with those of other countries, they will still make up the top 3 of the club market value ranking. Applying this logic to the rest of the 2023/24 UCL, we get the following.
PSG are clearly ranked first here. Now we have half of the European Value Pillar component. The other half comes from the UEFA 5-year coefficient ranking. Fortunately, UEFA does the heavy lifting for us.
Looking above, we can see that PSG are 6th here. Now we can calculate exactly where they sit on the European Value Pillar calculation (and ultimately determine how many shares they are allocated - please scroll up for a reminder on the shares system). The calculation is actually pretty simple. We add the two positions on each table and divide by two to find their average. For PSG this is (1+6)/2 = 3.5. The lower the number, the better.
Unfortunately, this is where we must take a few academic liberties. Multiple clubs that would presumably be in the top 10 for Value Pillar payments were not actually in the 2023/24 Champions League (Chelsea and Liverpool). So, we will fast-track our analysis and forgo a comprehensive revenue calculation for every team competing in the UCL this year.
Based on the data we have above, PSG finishes top of the European Value Pillar table, narrowly beating out Manchester City, which had a value of ‘4’, just larger than PSG’s 3.5. Therefore, PSG will earn 36 credits worth €935k each, resulting in a total of €33.66 million.
The rest of the Value Pillar is much easier to find. The Non-European part only requires us to look at 10-year coefficients.
PSG are 4th here, meaning they only receive 33 credits, worth €11.42 million in total.
Still with me? We are almost done. Let’s say PSG mimic their run from last year. Remember, PSG actually started the campaign quite poorly, finishing 15th in the group with four wins, one draw, and three losses. This required them to win in the knockout play-off as well.
Let’s find out how much they would earn this season.
Four wins and one draw = 4*2.1 + 0.7 = €9.1 million
15th place finish = 22 share * 0.275 = €6.05 million
9th-16th bonus = €1 million
Knockout Play-Off Round (clubs ranked 9th-24th) = €1 million
Round of 16 = €11 million
Quarter-Finals = €12.5 million
Semi-Finals = €15 million
Final = €18.5 million
Winner = €6.5 million
Let’s also not forget the starting fee of €18.62 million. Taking everything into account, if PSG win the Champions League this season, starting slow as they did last season (yes, that is very unlikely), they would earn…
€144.35 million!
Scenarios
Before we conclude, I thought it would be helpful to run through a few scenarios to highlight what different teams could expect to earn from their Champions League performances this season. While the PSG example was meant to show exactly how the distributions are calculated, the following three scenarios are here purely for illustrative purposes.
Dominant Champion
Assumptions
High ranking in the value pillar, excellent league phase finish, and winners of the entire tournament.
This team would earn ~€155 million - slightly more than PSG’s value as we assume a more successful league stage.
The Successful Overachiever
Assumptions
Mid-tier tanking in the value pillar, solid league phase (four wins, two draws, two losses, and finishing 15th), eliminated in the quarter finals.
This team would earn ~€85 million.
“Grouped”
Assumptions
Low ranking in the value pillar, poor league phase (two wins, one draw, five losses, and finishing 30th), and eliminated in the league stage.
This team would earn ~€32 million. For a team like Kairat Almaty, which has qualified for the Champions League for the first time, this amount is almost triple the entire value of their squad! This amount of money is life-changing for football clubs outside the major European leagues.
That’s all for now. If you enjoyed this piece, please feel free to leave a comment or a like! Happy to answer any DMs if you have any further questions.